Services Monitoring with Probabilistic Fault Detection

Let's admit it, the task of monitoring services is one of the most difficult. It is time-consuming, error-prone and difficult to automate. The usual monitoring approach has been pretty straightforward in the last few years: setup a service like Nagios, or pay money to get a cloud-based monitoring tool. Then choose the metrics you are interested in and set the thresholds. This is a manual process that works when you have a small number of services and servers, and you know exactly how they behave and what you should monitor. These days, we have hundred of servers with thousands of services sending us millions of metrics. That is the first problem: the manual approach to configuration doesn't work.
That is not the only problem. We know that no two servers perform the same because no two servers have exactly the same workload. The thresholds that you setup for one server might not be the correct one for all of the other thousand. There are some approaches to the problem that will make it even worse (like taking averages and setting the thresholds based on those, for example, hoping it will work). Let me tell you a secret: it won't work. Here we have a second problem: instances of the same type can demonstrate very different behaviors.
The last problem is that new shiny services you company may want to use are announced every week. It is impossible, because of time constraints, to know all of those services well enough to create a perfect monitoring template. In other words: sometimes we are asked to monitor software we don't completely understand.
In summary, you have thousands of services, some of them you don't even know how they work, that are sending you million of metrics that mean nothing to you. Now, set the thresholds and enable the pager alert. The nightmare has started. Is there a different approach?
Machine Learning
We have to stop thinking that monitoring is a bunch of config files with thresholds that we copy from one server to another. There are no magic templates that will work. We need to use a different technique that removes us from the process. That template is "machine learning." As stated in Wikipedia, it is a subfield of computer science that gives computers the ability to learn without being explicitly programmed. In it's most basic form, it can be used to solve classification problems. For example, open pet photos and identify if it is a cat or a dog. This is a classification problem that both humans and computers can solve, but we are much much slower. The computer has to take the time to learn the patterns, but at some point it will do the classification in no time.
I hope you are starting to see a pattern here. Why do we need to care about monitoring and its configuration if we have computers that can learn patterns and classify things for us?
There are two main ways of doing probabilistic fault detection: Novelty Detection and Outlier Detection.
Novelty Detection
Novelty Detection is easy to visualize and understand. It takes a series of inputs and tries to find anomalies, something that hasn't been seen before. For example, our credit card company has a function that takes "category, expense, date, hour, country" as arguments and returns an integer so that they can classify and identify all the purchases. Your monthly use of the credit card looks like this:
[0,4,4,5,5,5,4,3]
That is the normal model that defines your use of the credit card. Now, it can be used to detect anomalies.
- [0] – OK
- [4] – OK
- [4] – OK
- [1] – Anomaly! Operation canceled.
Easy and straightforward. It is simple and very useful in a lot of areas to generate alerts when something anomalous happens. One of the machine learning models that can do this is One-Class Support Vector Machines, but since this is not the kind of fault detection we are looking for I won't go into details. If you are interested, follow these links:
- One-Class Support Vector Machines in Scikit-Learn.
- Probabilistic Novelty Detection With Support Vector Machines from IEEE.
Outlier Detection
Let's say we have this data:
[0, 3, 5, 1, -2, 19, 2, 10, -9, 2, 1, 8, 3, 21, -1, 3]
Now we know how to find anomalies, but how do we find outliers? Looking at the numbers above, it seems 21, 19 and -9 could be outliers. But a more exact definition is needed (not just intuition). The most simple and usual way of doing it is the following:
We divide our data into three pieces. One cut will be done at 25%, the second cut at 75%. The number that it is at 25% is called the First Quartile of Third Quartile. The IQR or Interquartile Range is the subtraction of the Third Quartile with the First Quartile. Now, an outlier is any number that falls in one of these two categories:
- If the value is below: (First Quartile) – (1.5 × IQR)
- If the value is above: (Third Quartile + (1.5 × IQR)
Using Python:
inputs = [0, 3, 5, 1, -2, 19, 2, 10, -9, 2, 1, 8, 3, 21, -1, 3]
Q1 = np.percentile(inputs,25)
Q3 = np.percentile(inputs,75)
step = (Q3-Q1)*1.5
Q1
0.75
Q3
5.75
step
7.5
outliers = [x for x in inputs if x < Q1-step or x > Q3+step]
outliers
[19, -9, 21]
This looks more like what we need. If we are monitoring a metric, and outliers are detected, then something is happening there that requires investigation. Some of the most used outlier detection models in scikit-learn are:
-
Elliptic Envelope: a robust co-variance estimate that assumes that our data is Gaussian distributed. It will define the shape of the data we have, creating a frontier that delimits the contour. As you probably guessed, it will be elliptical in shape. Don't worry about the assumption of Gaussian distribution, data can be standardized. More about this later on.
-
Isolation Forest: this is the well-known "forest of random trees," but applied to outlier detection. This is more suitable when we have many different input metrics. In the example I use below, I just use a single metric, so this model would not work that well.
Therefore, Elliptic Envelope looks like the best option for our proof-of-concept.
For visual reference, this is how the three models look like when they try to shape two data inputs:
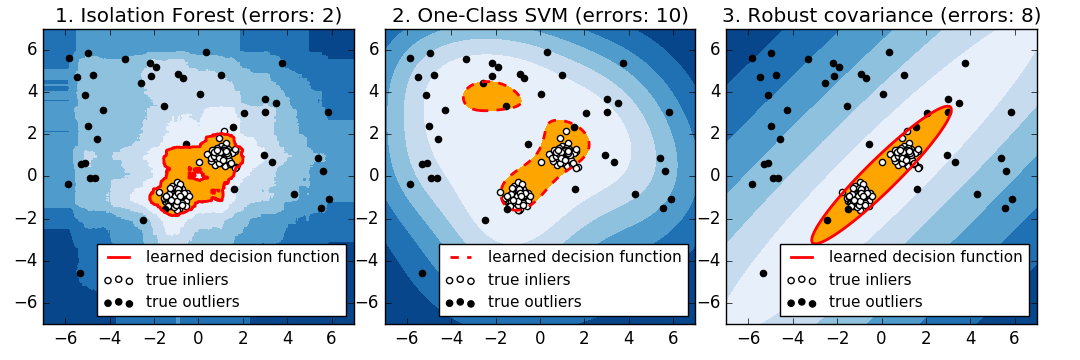
Source: scikit-learn.org
Proof-of-Concept
I haven't explained the model in detail, but a high level explanation should be enough to understand the problem and the possible solution. Let's start building a proof-of-concept.
For this test, I got data from our Prometheus setup, where all the time-series monitoring data from our customers is stored. In this particular example, I got numbers from the "Threads Running" metric. Those will be used to train our Elliptical Envelope. It is important to take the following into account:
- We need to collect enough data so that it captures the correct shape of our baseline performance. For example, usually nighttime hours have less of a workload than during the day (same with weekend days, in some cases).
- As explained before, it assumes a Gaussian distribution, which means that the data needs to be scaled. I am going to standardize the data so that it has 0 mean and 1 variance. The same standardization needs to be applied to the data we test after the training process, when the monitoring is already in place. That standardization also needs to be applied to each metric individually. This is the formula:
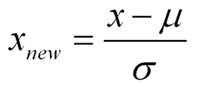
Source: dataminingblog.com
With μ as the mean and σ as the standard deviation.
This is the summary of what our proof-of-concept will do:
- Read Prometheus JSON dump.
- Separate some data for training, standardizing it first.
- Separate some data for testing, standardizing it first as well.
- Make predictions on test data.
- For those rows identified as outliers, get the original non-standardize data to see the number of threads running.
So, let's start:
Import the Libraries
import pandas as pd
import numpy as np
import json
from datetime import datetime
from sklearn.preprocessing import StandardScaler
from sklearn.covariance import EllipticEnvelope
Load the Data
All the information is in a JSON output from Prometheus that has the "threads_running" of a particular server. It has one second granularity for the last four weeks. I also converted "timestamps" to a normal "datetime" object so that it is easier to read:
with open('query.json') as data_file:
    data = json.load(data_file)
data = pd.DataFrame(data["data"]["result"][0]["values"])
data[0] = data[0].astype(int)
data[0] = data[0].apply(lambda x: datetime.fromtimestamp(x))
The data looks like this:
| DateTime | Threads Running |
|---|---|
| 2017-01-19 20:32:44 | 1 |
| 2017-01-19 20:32:45 | 1 |
| 2017-01-19 20:32:46 | 2 |
| ... | ... |
Create the Training and Testing Dataset
First, separate some of the data for use as training:
train_data = data[(data[0] >= "2017-01-22") & (data[0] <= "2017-01-28" )]
Ignore the date column, and just store the metrics:
train_data = train_data.iloc[:,[1]]
Standardize it:
escaler = StandardScaler()
train_data = escaler.fit_transform(train_data)
Now the data looks like this:
| Standardized Threads Running |
|---|
| -0.4072634 |
| -0.40726345 |
| 0.47153585 |
| ... |
To create the test dataset we need to follow the exact same procedure, only select a different timeframe:
test_original_data = data[(data[0] >= "2017-02-2") & (data[0] <= "2017-02-17" )]
test_data = test_original_data.iloc[:,[1]]
test_data = escaler.transform(test_data)
Train the Model
Let's create our model with the training data! I am using two parameters here:
- assume_centered: to specify that our data is already Gaussian distributed.
- contamination: to specify the ratio of outliers our training data has.
clf = EllipticEnvelope(assume_centered=True,contamination=0)
clf.fit(train_data)
Search for Outliers
Now that we've trained the model and we have our test data, we can ask the model if it finds any outliers. It will return 1 or -1 for each row. "1" means that the value of threads running is normal and within the boundaries, while "-1" means that the value is an outlier:
predictions = clf.predict(test_data)
outliers = np.where(predictions==-1)
The array "outliers" stores the row numbers where -1 was predicted.
At this point we have three important variables:
- test_data: standardized testing data.
- test_original_data: the original test data without modification.
- outliers: the row numbers where an outlier was detected (-1).
Investigate the Outliers
Since we have the row number where an outlier was detected, now we can just query test_original_data and search for those rows. In this example, I show some random ones:
for indice in outliers[0]:
    if np.random.randn() > 2.5:
        print("{} - {} threads running".format(test_original_data.iloc[indice][0], test_original_data.iloc[indice][1]))
2017-02-03 11:26:03 - 41 threads running
2017-02-03 11:26:40 - 43 threads running
2017-02-03 11:27:50 - 48 threads running
2017-02-03 11:32:07 - 78 threads running
2017-02-03 11:33:25 - 90 threads running
2017-02-12 10:06:58 - 36 threads running
2017-02-12 10:12:11 - 60 threads running
2017-02-12 10:12:30 - 64 threads running
And there we have it! Dates and hours when something really out of the ordinary happened. No need to create a config file for each service, guess thresholds, adjust them … nothing. Just let the model learn, and you get alerts when something unexpected happens. Push all the metrics from your services to these models, and let them do the hard work.
Summary
Most companies have similar situations. Companies add new services on hundred of servers, and monitoring is an essential part of the infrastructure. The old method of monolithic config files with some thresholds doesn't scale, because it needs a lot of manual work with a trial/error approach. The types of techniques explained in this blog post can help us deploy monitoring on hundred of servers, not really caring about the different nuances of each service or workload. It is even possible to start monitoring a service without even knowing anything about it — just let the probabilistic model take care of it.
It is important to clarify that, in my opinion, these fault detection models are not going to be a substitute for software like Nagios. In those areas where a binary test is needed (service is up/down for example), Nagios and other similar services do a good job. Actually, a Nagios check can use the procedure explained here. When there are many metrics to analyze, probabilistic methods can save us from a nightmare.