Prophet: Forecasting our Metrics and Predicting the Future
![]()
Facebook recently released a forecasting tool called Prophet. Prophet can forecast a particular metric in which we have an interest. It works by fitting time-series data to get a prediction of how that metric will look in the future. In this blog post, we'll look at how Prophet can forecast metrics.
For example, it could be used to:
- Predict how much HTTP traffic we will get, and scale accordingly when needed
- See if a particular feature of our application will have success or if its usage will decline
- Get an approximate date when our database server's resources will be exhausted
- Forecast new customer's sign up and resize the staff accordingly
- See what next year's Black Friday or Cyber Monday will look like, and if we have the resources to handle them
- Predict how many animals will enter a shelter in the coming years, as I did in a personal project I will show here
At its core, it uses a Generalized Additive Model. It is basically the merging of two models. First, a generalized linear model that, in the case of Prophet, can be a linear or logistic regression (depending on what we choose). Second, an additive model applied to that regression. The final graph represents the combination of those two. That is, the smoothed regression area of the variable to predict. For more technical details of how it works, check out Prophet's paper.
Most of the previous points can be summarized in a simple concept, capacity planning. Let's see how it works.
Usage Example
Prophet provides either a Python or R library. The following example will use the Python one. You can install it using:
pip install prophet
Prophet expects the metrics with a particular structure: a Pandas DataFrame with two columns, ds and y:
| ds | y | |
|---|---|---|
| 0 | 2013-10-01 | 34 |
| 1 | 2013-10-02 | 43 |
| 2 | 2013-10-03 | 20 |
| 3 | 2013-10-04 | 12 |
| 4 | 2013-10-05 | 46 |
| ... | ... | ... |
The data I am going to use here is from Kaggle Competition Shelter Animal Outcomes. The idea is to find out how Austin Animal Center's workload will evolve in the future by trying to predict the number of animal outcomes per day for the next three years. I am using this dataset because it has enough data, shows a very simple trend and it is a non-technical metric (no previous knowledge on the topic is needed). The same method can be applied to most of the services or business metrics you could have.
At this point, we have the metric stored in a local variable, called "series" in this particular example. Now we only need to fit it into our model:
m = Prophet()
m.fit(series);
and define how far into the future we want to predict (three years in this case):
future = m.make_future_dataframe(periods=365*3)
Now, just plot the data:
m.plot(future)
plt.title("Outcomes forecast per Year",fontsize=20)
plt.xlabel("Year",fontsize=20)
plt.ylabel("Number of outcomes",fontsize=20)
plt.show()
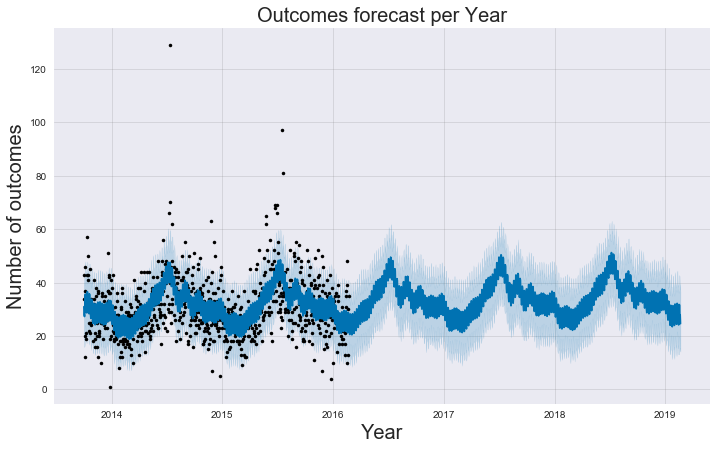
The graph shows a smoothed regression surface. We can see that the data provided covers from the last months 2013 to the first of 2016. From that point, those are the predictions.
We can already find some interesting data. Our data shows a large increase during the summer months and predicts it to continue in the future. But this representation also has some problems. As we can see, there are at least three outliers with values > 65. The fastest way to deal with outliers is to just remove them. 🙂
series[series["y"]>65]
| ds | y | |
|---|---|---|
| 0 | 2014-07-12 | 129 |
| 1 | 2015-07-18 | 97 |
| 2 | 2015-07-19 | 81 |
| ... | ... | ... |
series.drop(series[series["y"]>60].index,inplace=True)
Now the graph looks much better. Let's also add a horizontal line that will help to see the trend:
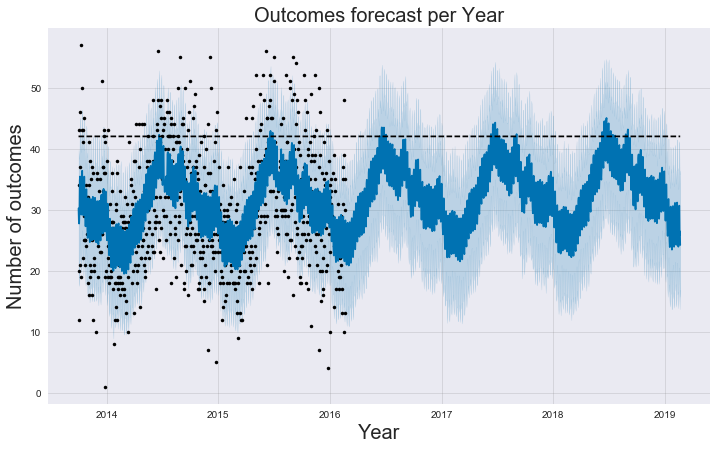
From that forecast, Austin Animal Center should expect an increase in the next few years but not a large one. Therefore, the increase trend year-over-year won't cause problems in the near future. But there could be a moment when we reach the shelter's maximum capacity.
Recommendations
- If we want to forecast a metric, we recommend you have at least one year of data to fit the model. If we have less data, we could miss some seasonal effects. In our model above, for example, the large increase of work during summer months.
- In some cases, you might only want information about particular holidays (for example Black Fridays or Christmas). In that case, it is possible to create a model for those particular days. The documentation explains how to do this. But in summary, you need to create a new Pandas DataFrame that includes all previous Black Friday dates, and those from the future that you want to predict. Then, create the model as before, but specify that you are interested in a holiday effect:
m = Prophet(holidays=holidays)
We recommend you use daily data. The graph could show strange results if we want daily forecasts from non-daily data. In case the metric shows monthly information, freq='M' can be used (as shown in the documentation).
Conclusion
When we want to predict the future of a particular metric, we can use Prophet to make that forecast, and then plan for it based on the information we get from the model. It can be used on very different types of problems, and it is very easy to use. Do you want to know how loaded your database will be in the future? Ask Prophet!